Advanced InfluxDB queries for Grafana visualizations
Here I document some more advanced InfluxDB queries which I use on my Grafana dashboard.
Daily ‘sawtooth’ from increasing counter 
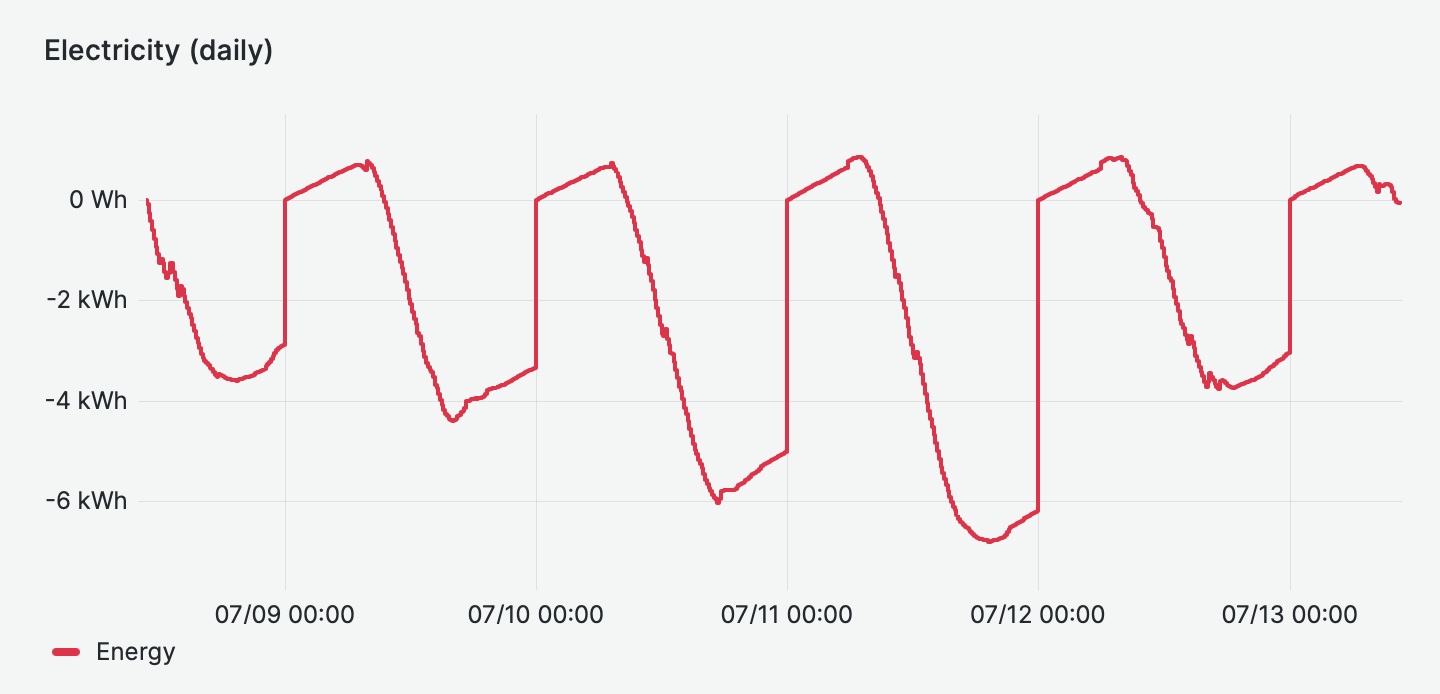
Given a monotonically increasing counter (e.g. an electricity meter), I graph this as a ‘sawtooth’ where I show a line graph of the counter value which resets daily. This is nice because you see daily usage patterns and can easily compare the totals (=the top of the sawtooth). Conceptually this is done by running 2 subqueries (influxdata.com) in InfluxDB and subtracting them (also see my post on StackOverflow (stackoverflow.com)):
- Query the counter bucketed in days (i.e.
GROUP BY time(1d)) - Query the counter on the desired time bucketing (e.g.
GROUP BY time(15m))
The data looks something like this:
> select * FROM energyv3 WHERE (source = 'electricity') order by desc limit 10
name: energyv3
time                 source      value
----                 ------      -----
2023-07-13T09:04:08Z electricity 10362340800
2023-07-13T09:03:09Z electricity 10362409200
2023-07-13T09:02:10Z electricity 10362477600
2023-07-13T09:01:11Z electricity 10362556800
2023-07-13T09:00:12Z electricity 10362636000
2023-07-13T08:59:03Z electricity 10362726000
2023-07-13T08:58:04Z electricity 10362805200
2023-07-13T08:57:05Z electricity 10362888000
2023-07-13T08:56:06Z electricity 10362967200
2023-07-13T08:55:07Z electricity 10363050000
The InfluxQL query for my Grafana dashboard looks like:
SELECT (electricity-electricity_daily) as Energy FROM
  (SELECT FIRST(value) as electricity_daily FROM energyv3 WHERE source='electricity' AND $timeFilter group by time(1d)),
  (SELECT FIRST(value) as electricity FROM energyv3 WHERE source='electricity' AND $timeFilter GROUP BY time($__interval))
fill(previous)
where:
- $__interval (grafana.com) and $timeFilter (grafana.com) are the variable time bucketing/filters used by Grafana. When using subqueries, make sure you do the time filtering on the lowest level, else a lot of data is queried for nothing.
FIRST()is used because we need to subtract the counter value of the beginning of the day
Which results in:
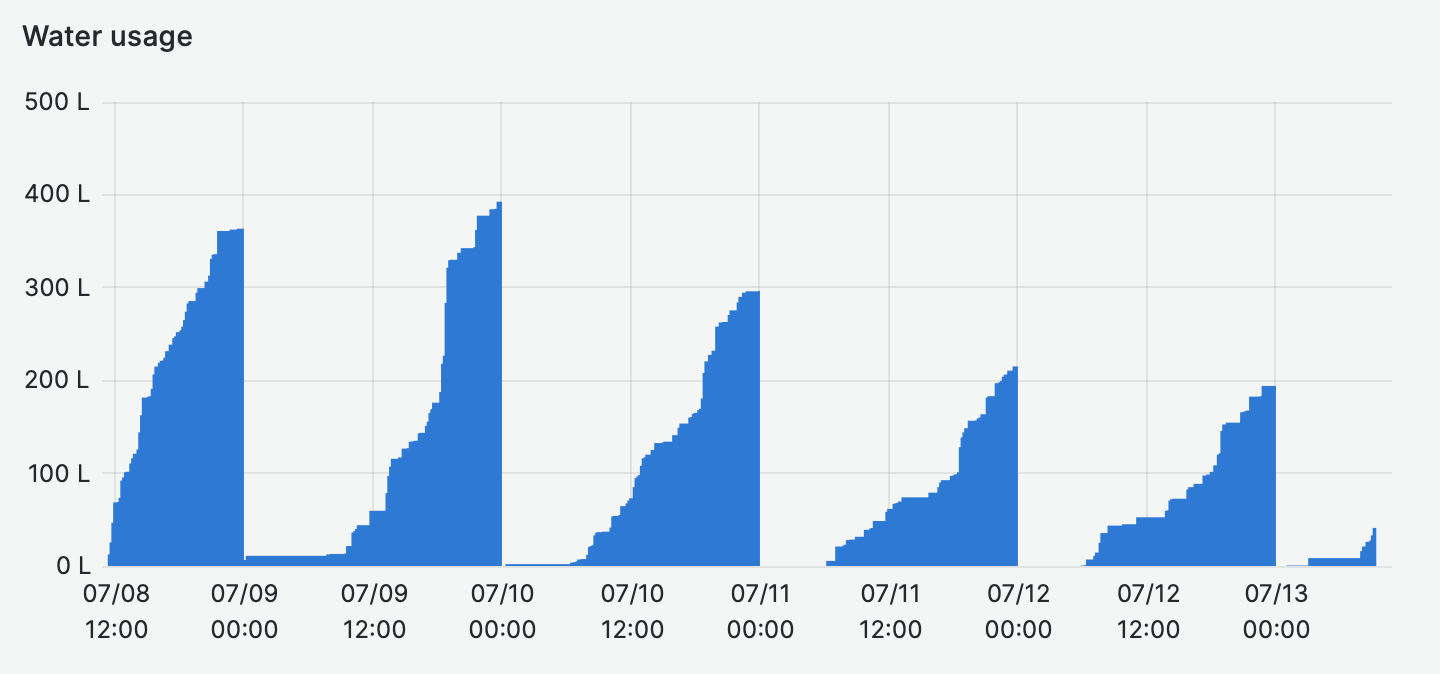
Daily ‘sawtooth’ from pulse counter 
Given a rate counter (e.g. a counter that gives a pulse for X usage, like my water meter which pulses every 0.5L), you can also achieve a sawtooth graph like above, but this requires a bit more processing.
The data looks something like this:
> select * FROM waterv3 WHERE (source = 'water') order by desc limit 10
name: waterv3
time                 source value
----                 ------ -----
2023-07-13T07:24:56Z water  0.5
2023-07-13T07:05:37Z water  0.5
2023-07-13T07:05:34Z water  0.5
2023-07-13T07:05:30Z water  0.5
2023-07-13T07:05:27Z water  0.5
2023-07-13T07:05:23Z water  0.5
2023-07-13T07:05:20Z water  0.5
2023-07-13T07:05:16Z water  0.5
2023-07-13T07:05:13Z water  0.5
2023-07-13T07:05:09Z water  0.5
The InfluxQL query for my Grafana dashboard looks like:
SELECT water-water_daily as Water FROM
  (SELECT first(water2) as water_daily FROM
    (SELECT CUMULATIVE_SUM("value") as water2 FROM "waterv3" WHERE ("source" = 'water') AND $timeFilter)
    GROUP BY time(1d)),
  (SELECT CUMULATIVE_SUM(sum("value")) as water FROM "waterv3" WHERE ("source" = 'water') AND $timeFilter GROUP BY time($__interval))
fill(previous)
where we need a double subquery for the daily value because we need to CUMULATIVE_SUM() first, and then apply GROUP BY()
Which results in: