Measuring calibrated Hue energy usage via bridge
(Updated: )
I’m trying to break down where my household electricity usage goes, and lighting is one rather difficult to quantify since there are many devices that have somewhat irregular usage patterns. To alleviate this, I wrote a script to query the Hue (compatible) bulb brightness from the Hue bridge, convert this to power via brightness-to-power calibration curves, and store this to InfluxDB.
I also documented this along with the script at Github (github.com).
Method 
To store the energy usage in InfluxDB, I use the approach below in hue_worker.py (github.com).
- Per lamp, query brightness, state (=on/off), uniqueid, modelid
- Per lamp, compute power_min + (brightness*state)**2 * (power_max - power_min)
- Query last data point from InfluxDB including timestamp
- Write new energy use point in InfluxDB Note that the state is required because the brightness is preserved even when the bulb is off.
Calibration 
To get brightness to power mapping, I used a Brennenstuhl PM 231 E power meter (tweakers.net) with rated power measurement precision of +/-1% or +/-0.2 W. For idle power, in some cases I confirmed the meter’s linearity by a constant base load of 15W (incandescent bulb). The results are shown in the below table and graph.
| Type | ModelID | Rated brightness (lm) | Rated power (W) | Measured max power (W) | Idle power (W) | Efficiency (lm/W) |
|---|---|---|---|---|---|---|
| Ikea Trådfri E27 | TRADFRI bulb E27 W opal 1000lm | 1000 | 12.5 | 12.8 | 0.3 | 78 |
| Ikea Trådfri E14 | TRADFRI bulb E14 WS opal 400lm | 400 | 5.3 | 4.4 | 0.4 | 91 |
| Philips Hue White Ambiance E27 | LTW010 | 806 | 9 | 6.8 | 0.3 | 118 |
| Philips Hue White Ambiance E14 | LTW012 | 470 | 6 | 4.5 | 0.3 | 104 |
| Philips Hue LightStrip+ (2 meter) | LST002 | 1600 | 20.5 | 16.7 | 0.1 | 96 |
| Philips Hue LightStrip+ (4 meter) | LST002 | 3500 | 43.5 | 23.0 | 0.1 | 152 |
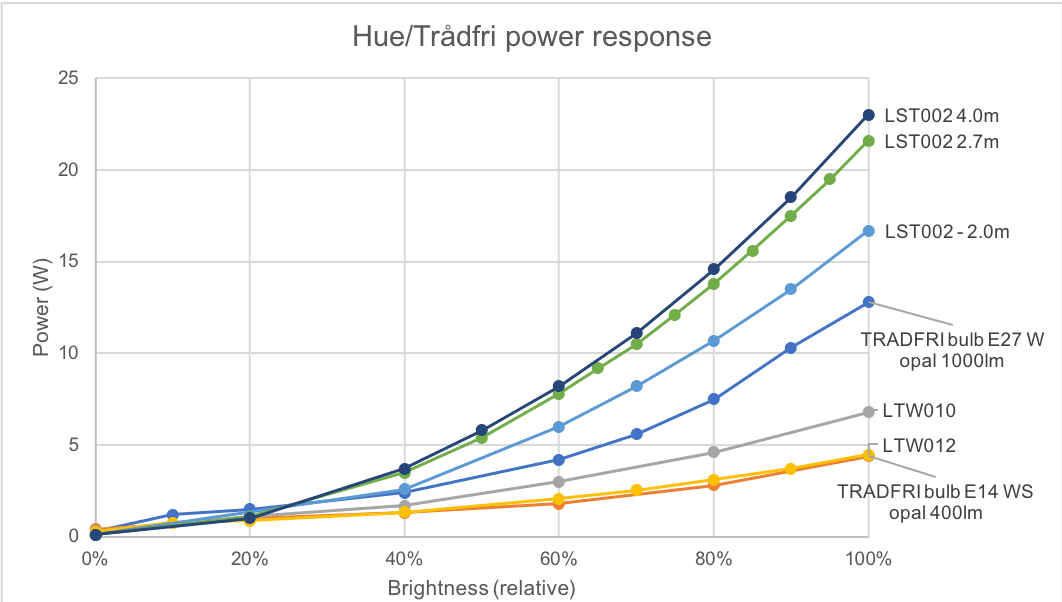
Note that I have three different lightstrips, one of nominal 2.0m length, one of 2.7m, and one of 4.0m length. Surprisingly, the 4.0m version only uses ±40% more power (instead of expected 100%). It could be that the adapter/driver is overspec’ed for only 2m strips (since they can drive up to 10m), and therefore become more efficient at higher loads.
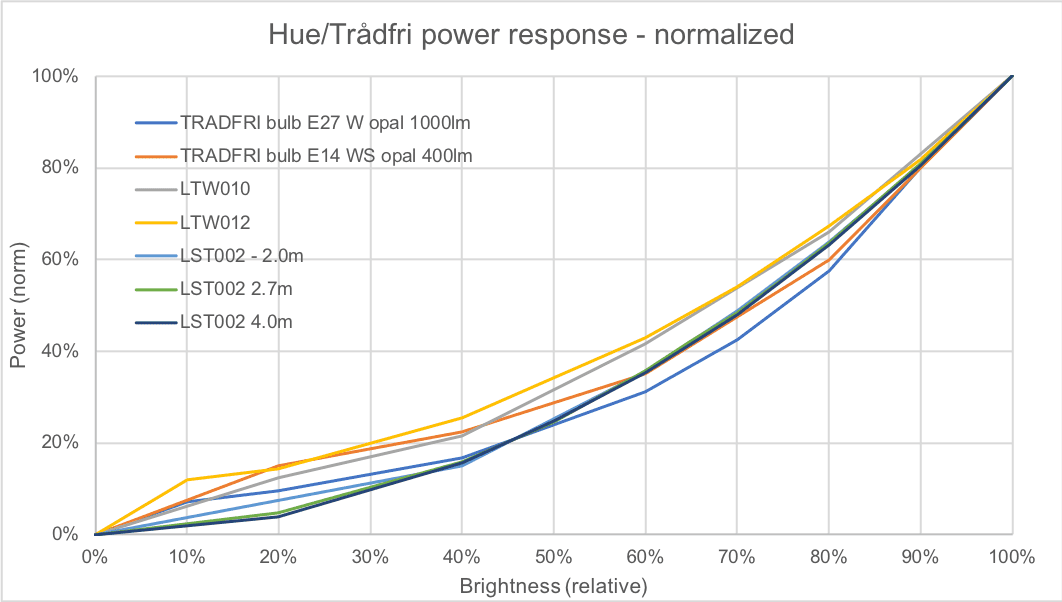
After getting brightness to power data, I normalized these and subtracted the 0 brightness (idle) power to get the curves below.
Finally, I fitted the curve (yeah yeah, that’s Excel, apologies) to get a calibration curve for all lights. I could have made a curve per bulb, but didn’t feel this was worth the trouble.
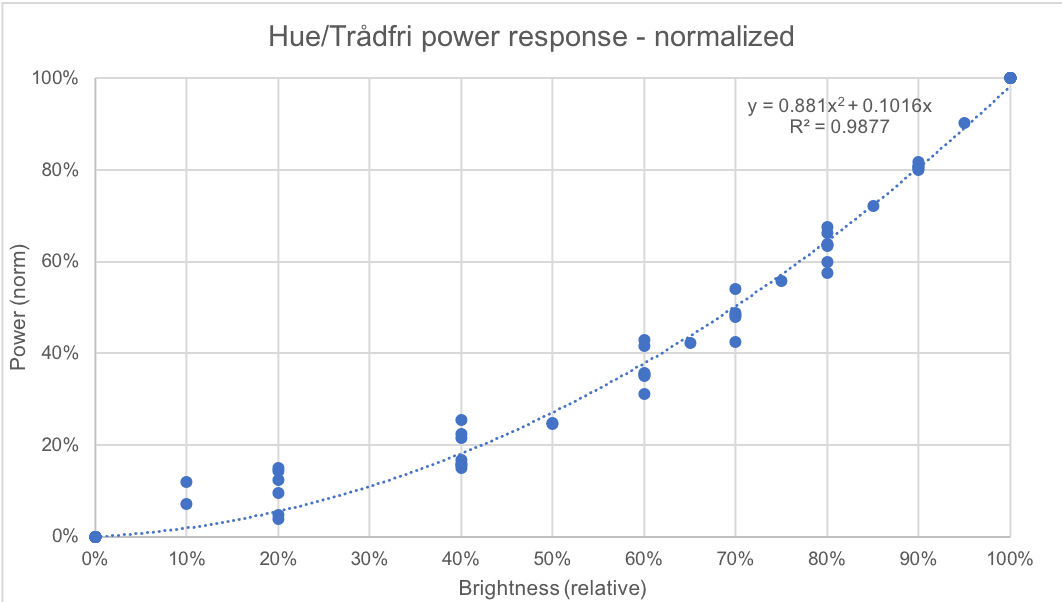
Although I expected an exponential response curve due to eyesight behaving logarithmically, it turns out the response is quadratic. For simplicity I ignored the factor 0.881 and the linear component of the response and just use power = brightness^2.