Connecting sensors to Rpi (2/3)
(Updated: )
Here I describe the various sensors I connected to my RPi. Specifically:
- Kaifa DSMR 4.0/4.2 smart meter
- SMA sunnyboy PV inverter
- Honeywell Evohome thermostat
- Sensus analog water sensor
- Landis+Gyr Ultraheat digital 7-segment LCD heat meter
Kaifa DSMR smart meter (‘slimme meter’) 
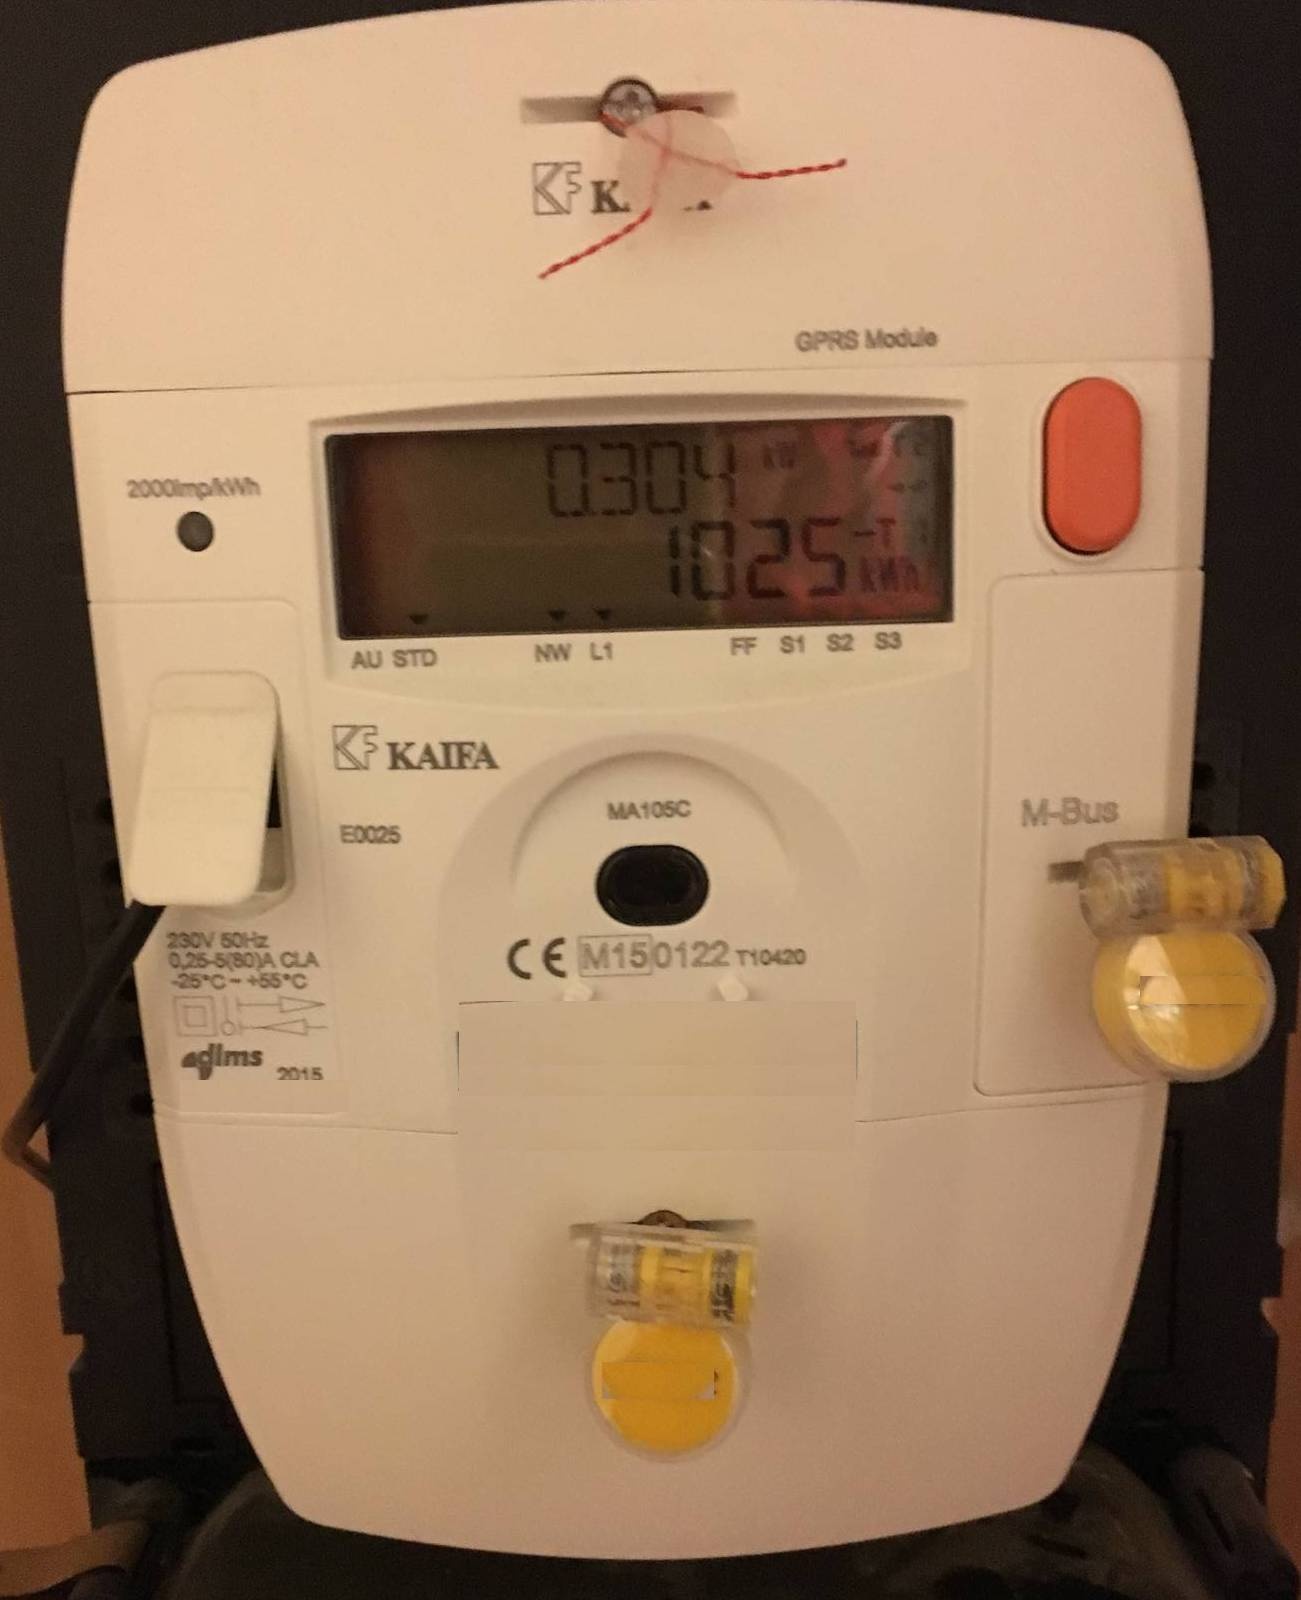
I have a Kaifa MA105(c)/MA304(c) DSMR4.0/DSMR4.2 meter (stedin.net). Simply connect this using a so called ‘P1-cable’ to the RPi (via hub or otherwise). I bought my P1 cable at SOSSolutions (sossolutions.nl). There are a number of programs that can read it out:
- Domoticz (domoticz.com) - a home automation hub
- smeterd (github.com) - a command-line python script
- DSMR-P1-telegram-reader (github.com) - another python script
- dsmr-reader (github.com) - a python hub including graphing
- Manually - see this guide (in Dutch) (domoticx.com) I use option 1 and push the data to influxdb using a dzVents Lua script (github.com).
More info on the smart meter is here: https://www.netbeheernede…e_meter_15_a727fce1f1.pdf (netbeheernederland.nl). Instructions to make your own P1 cable (domoticz.com).
SMA Sunny Boy PV inverter 
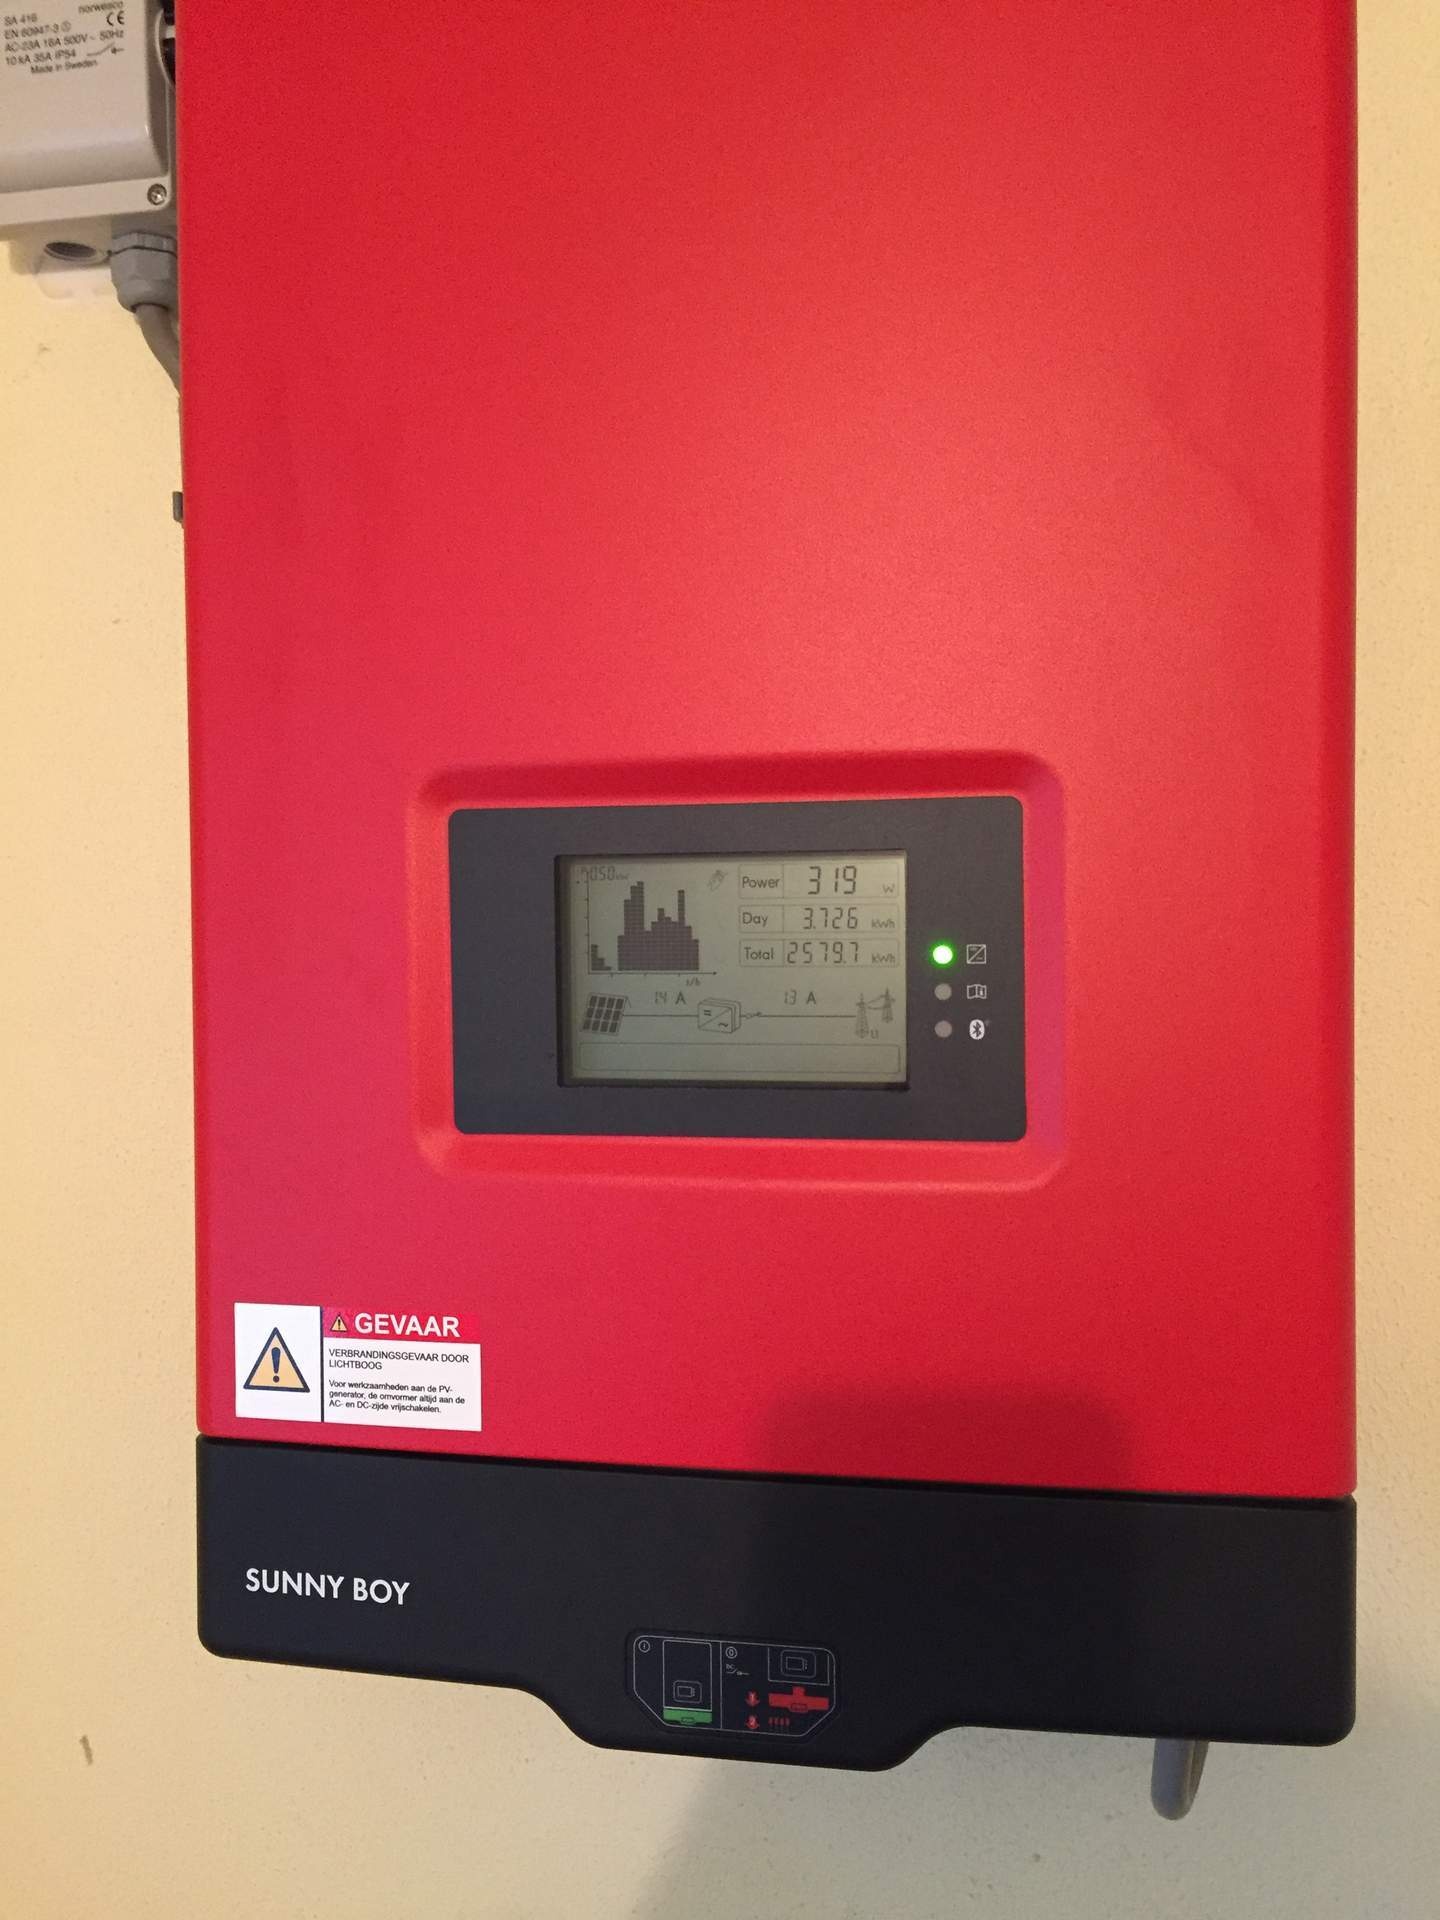
The Sunny Boy 2000HF/2500HF/3000HF inverter for our solar panels can actually be read out over bluetooth :o. There are several tools to make this easier:
- SBFspot (github.com) - C-program that outputs to sqlite, mysql, or CSV. This was called SMASpot before. 1. I made a script to push this to influxdb (github.com) 2. domoticz can read this natively (domoticz.com). Note that domoticz does not use the timestamp from the CSV file, but the local time when it reads the file, which gives a ±1 minute error.
- German blog on install instructions (alexbloggt.com) (uses dated SMAspot). Find the inverter using hcitool scan from the command-line.
Before I figured out it supported bluetooth, I failed at two alternative read out methods. These might be of help to you:
Read out pulse signal or 62056 port 
62056 = DIN IEC 62056-21 and I believe is a definition of pulse generation. S0 = DIN 43864, which seems to be something related, but different.
I have this em-lite ECA2 meter (co.uk) which gives optical pulses when generating power. There are several solutions for reading this out: an OpenEnergyMonitor pulse sensor (openenergymonitor.com), instructions to read out using arduino (mysensors.org), or instructions to build your own sensor (volkszaehler.org).
Read out via Solo III geotogether energynote hub 
It seems the em-lite meter mentioned above has a wireless connection capability with a geo together Solo III hub. This hub can then be connected to energynote and upload data somewhere. I didn’t get this to work. Sources: https://www.youtube.com/watch?v=1zTQLphHd9o (youtube.com) and https://www.energynote.eu/?lang=en (energynote.eu) and https://support.geotogether.com/en/support/home#. (geotogether.com)
Honeywell Evohome thermostat 
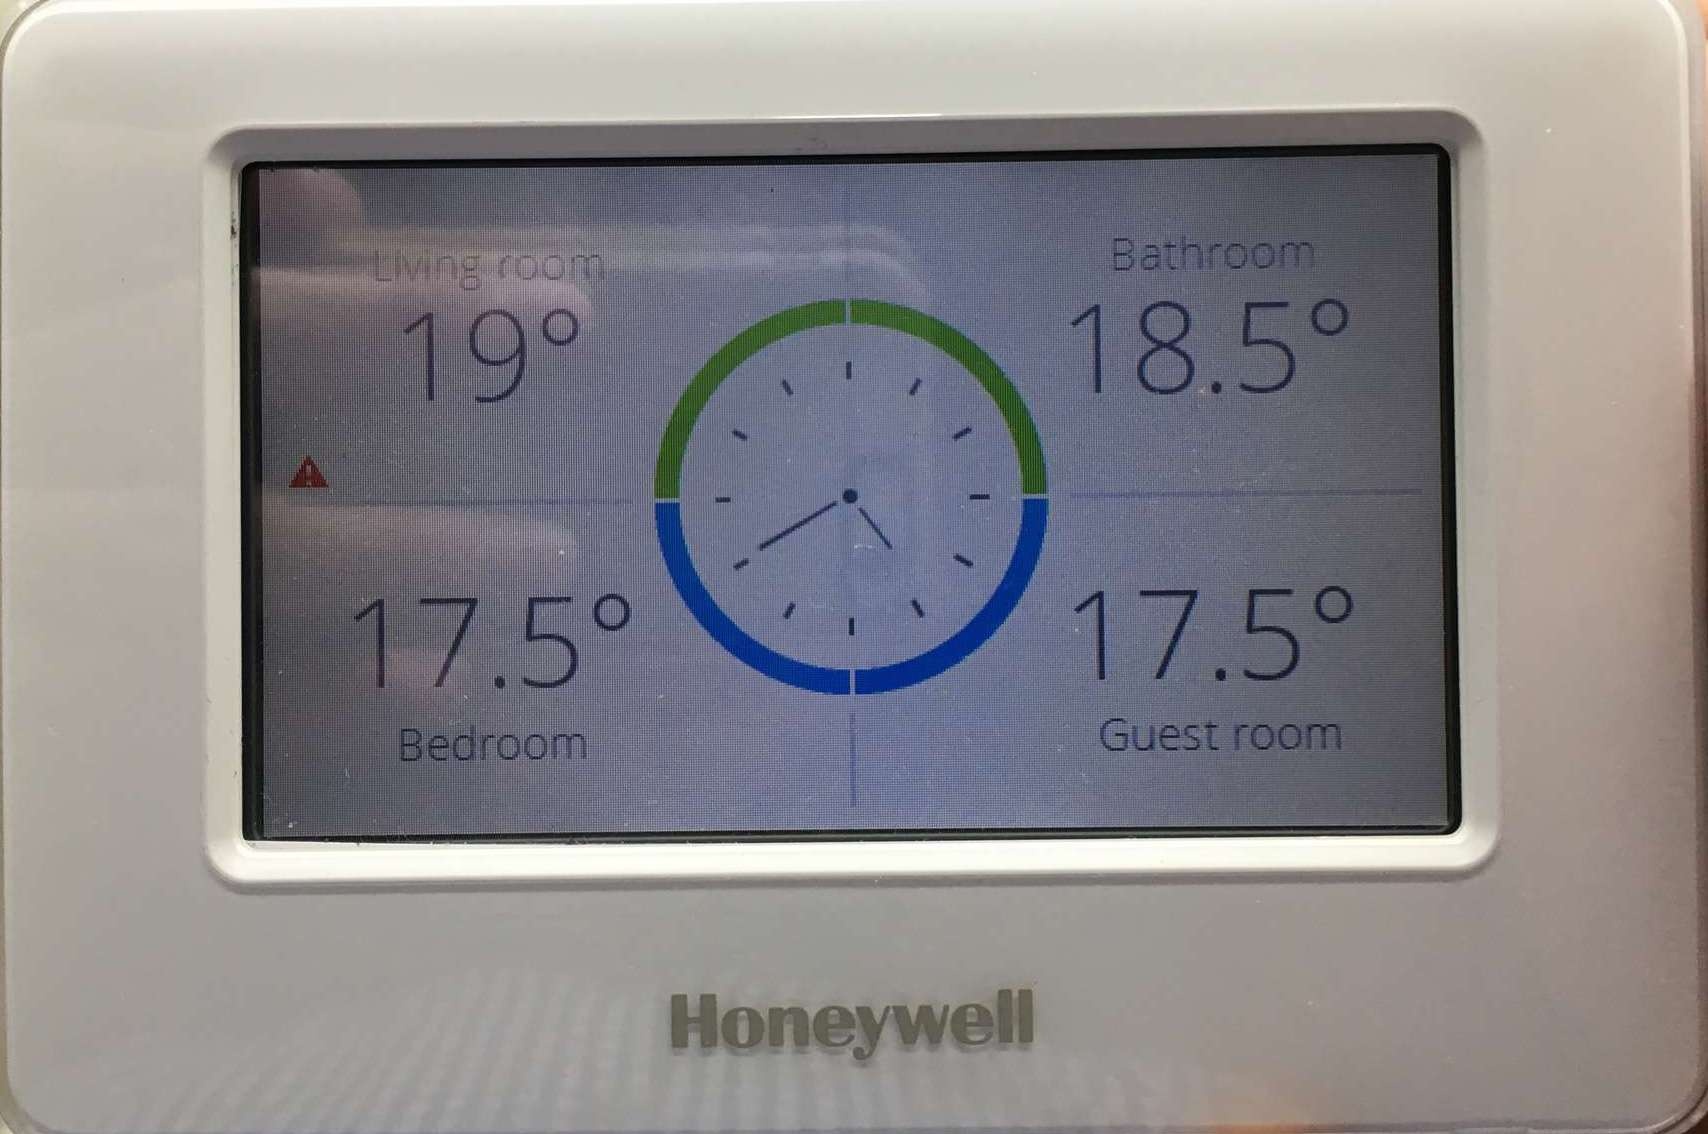
I read out the Honeywell thermostat thermometers using the web API connected to Domoticz (domoticz.com).
I then push the data to influxdb using a dzVents Lua script (github.com).
Sensus analog water sensor 
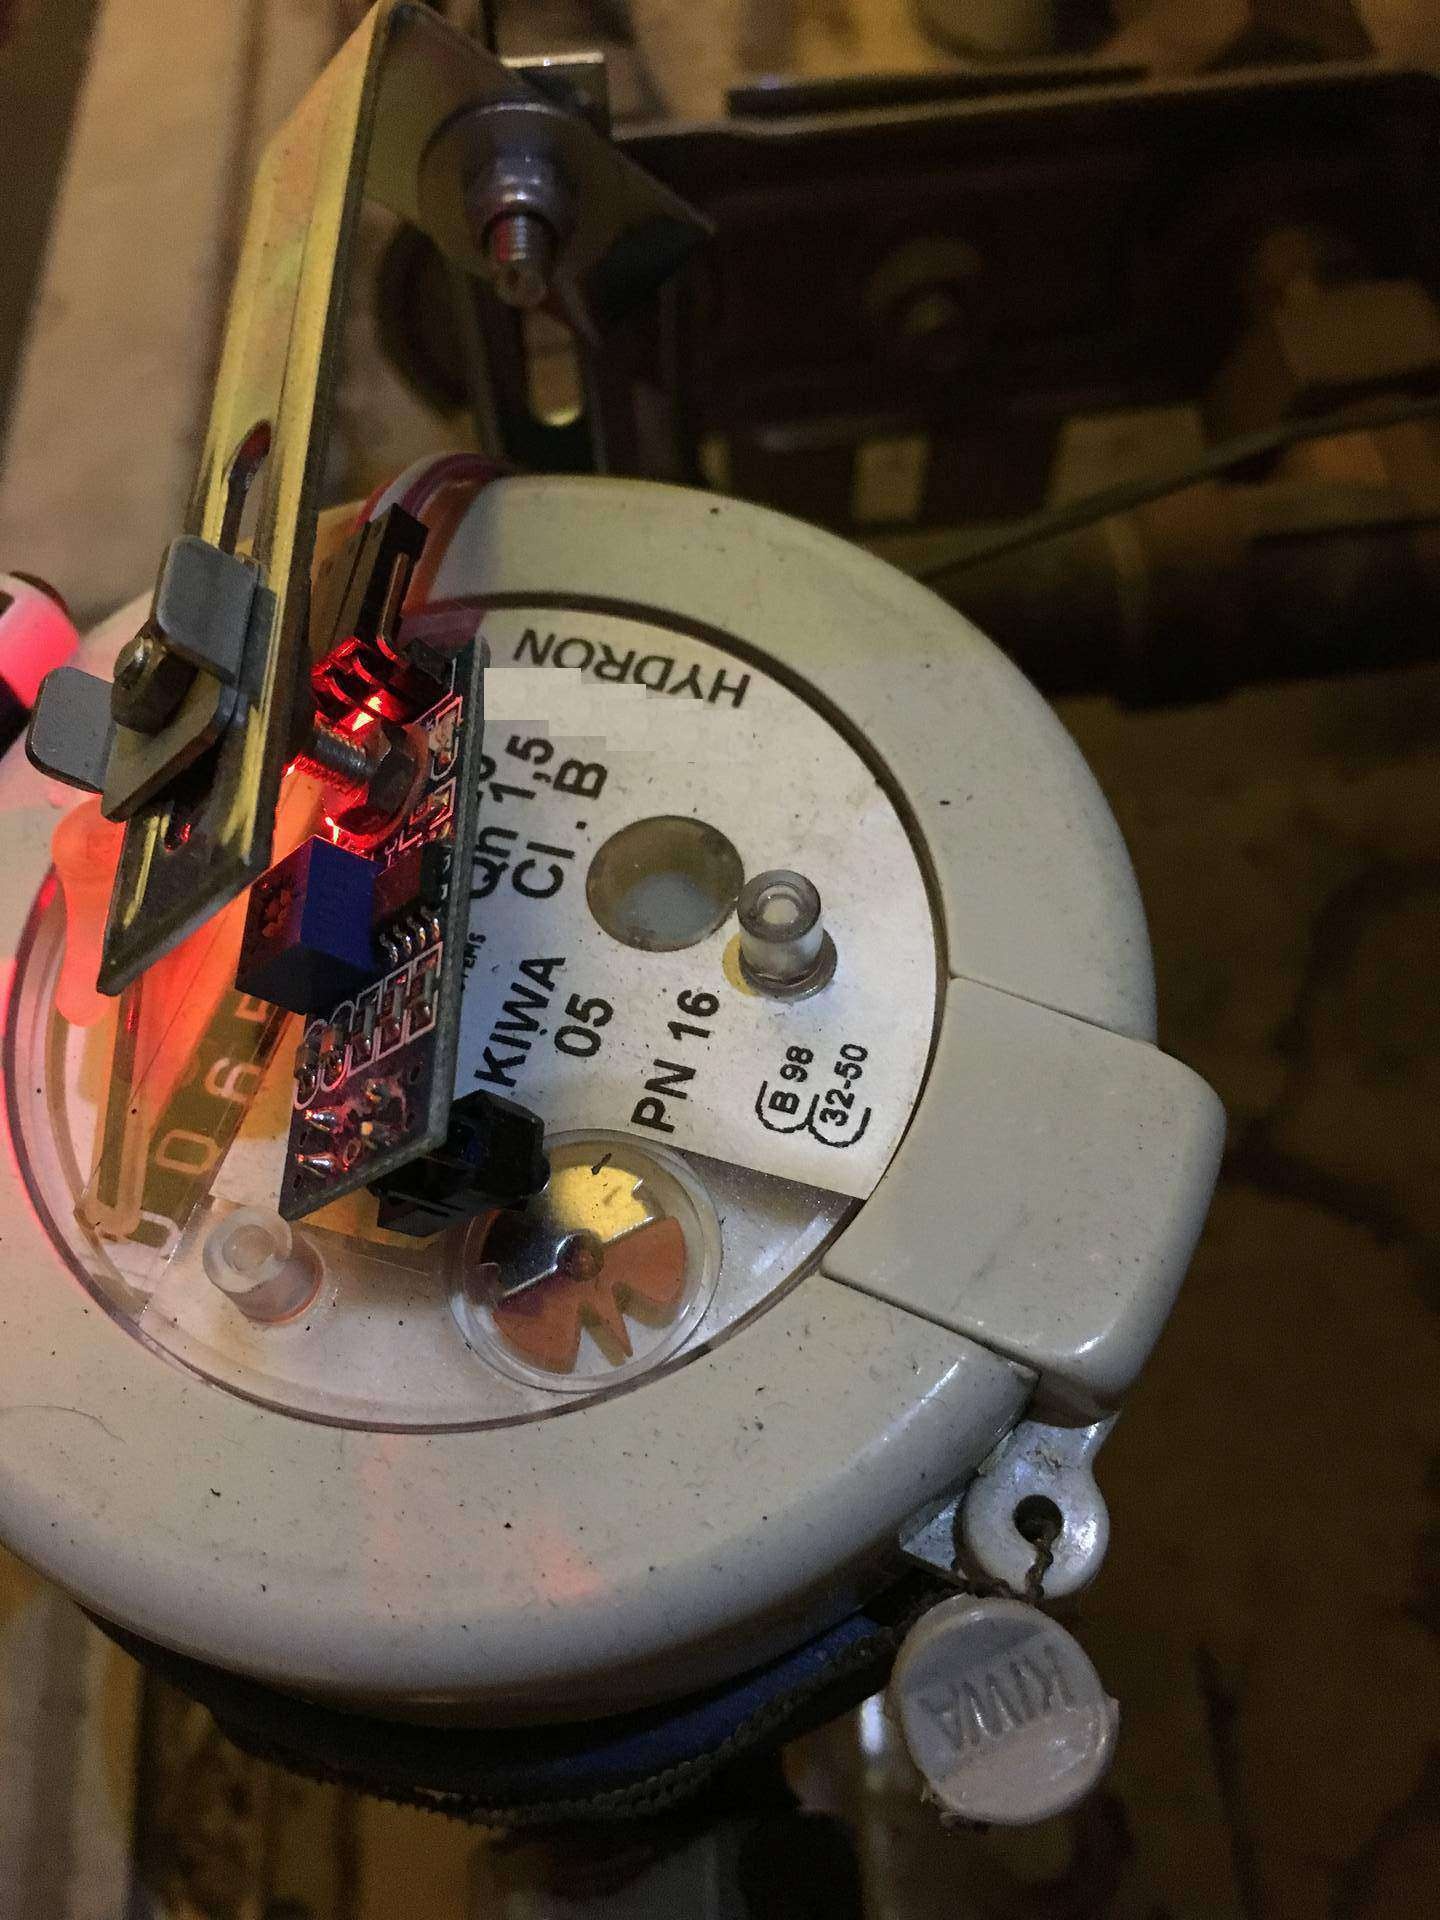
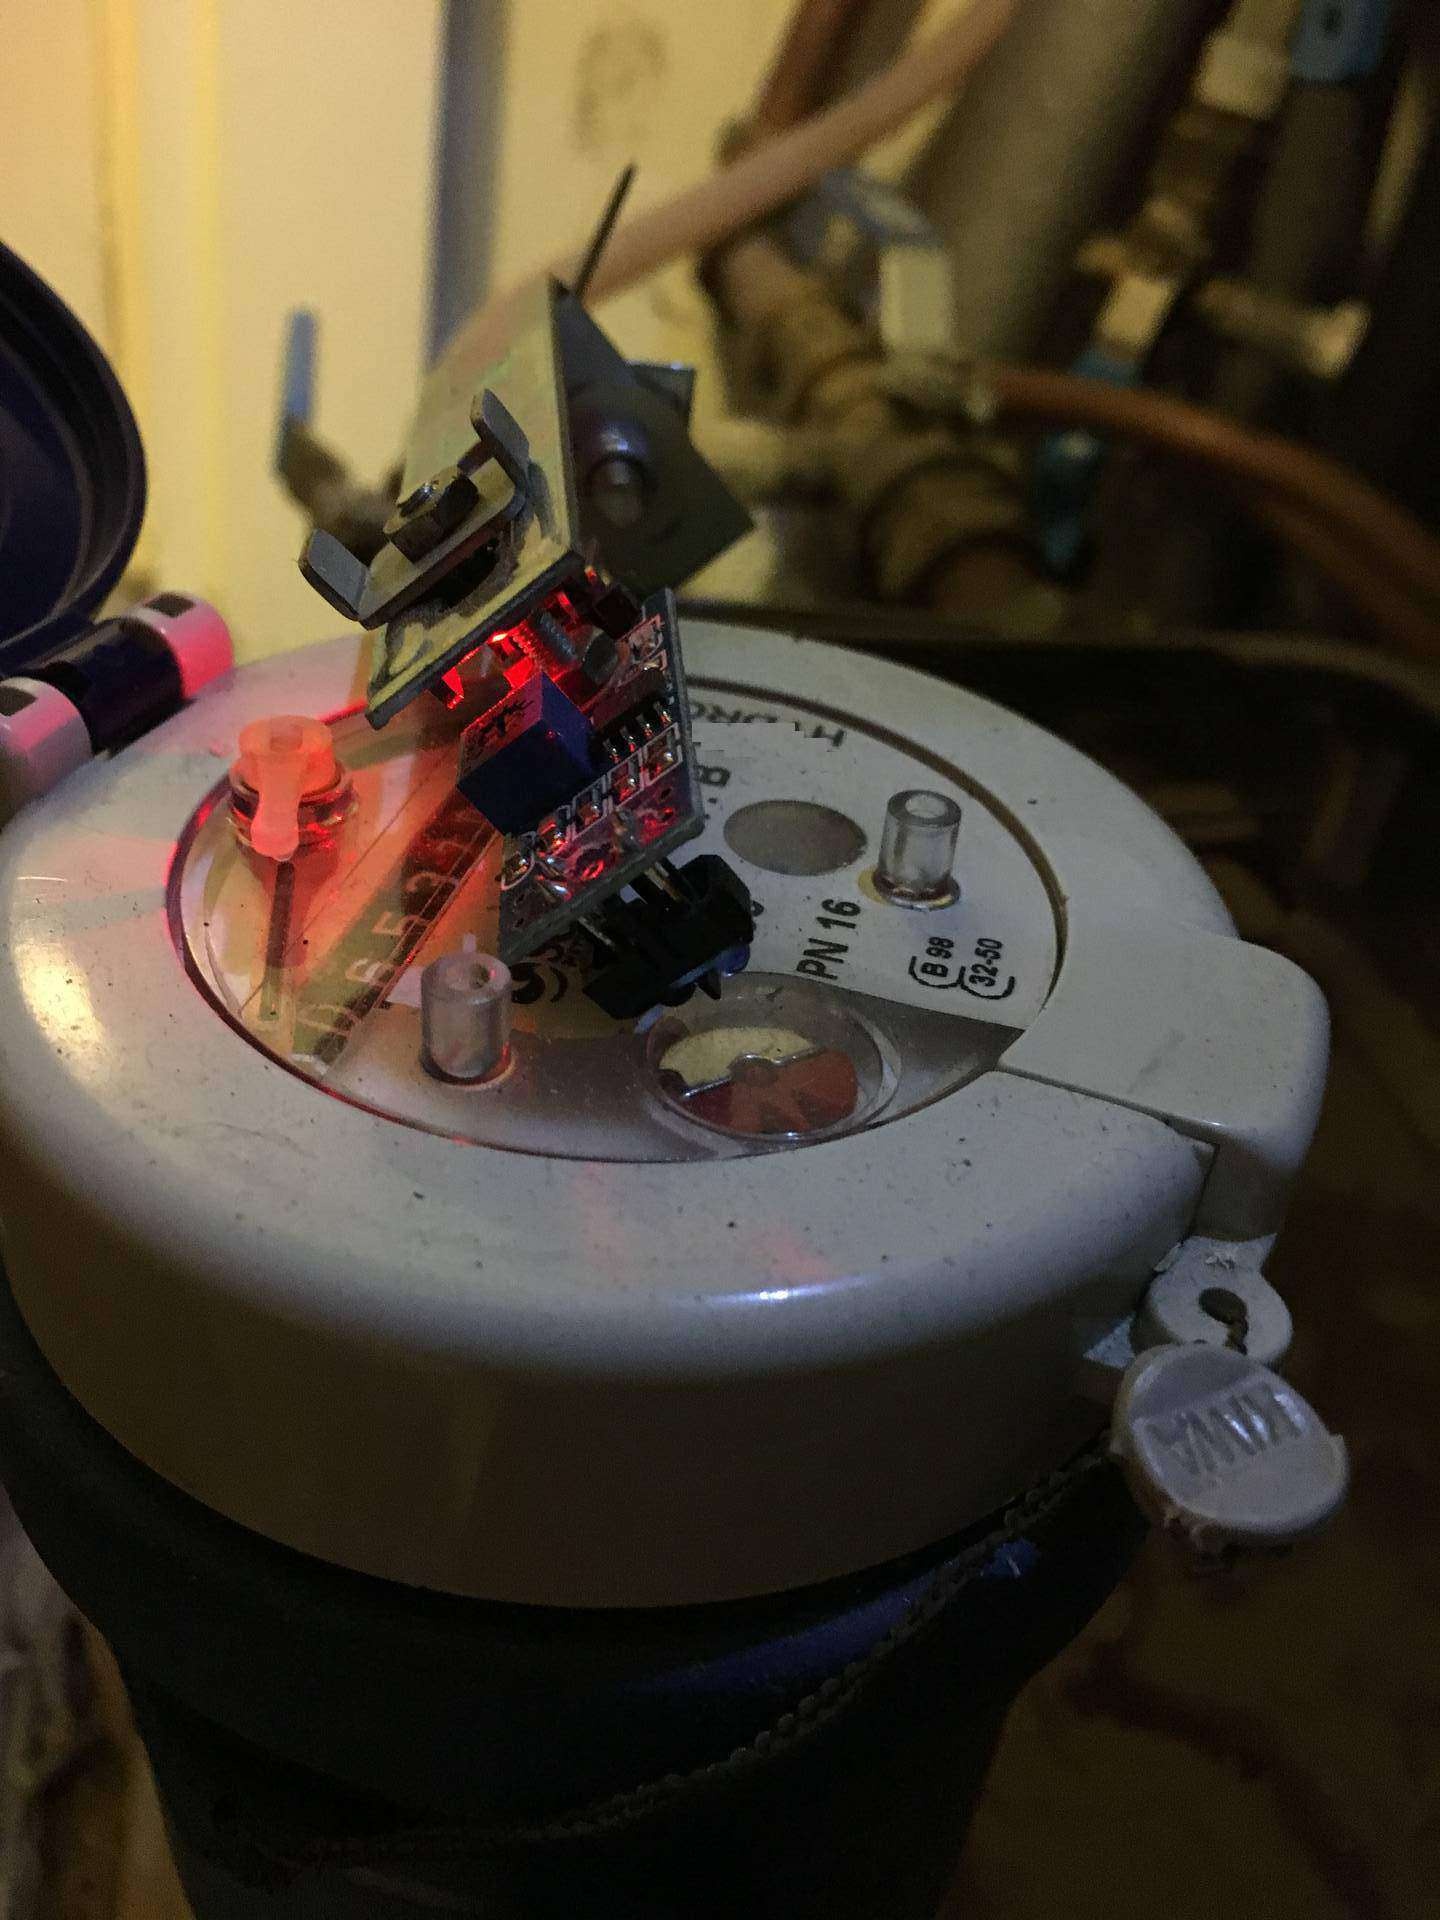
I have an analog Sensus water meter (sensus.com) which I read out using a line sensor connected to GPIO (raspberrypi.org) on my RPi via a Python script. This sensor detects of the red-white rotating disc through the difference in IR reflection. Alternatively, you could read out the magnetic field (change) using a Hall sensor (hobbyelectronica.nl), but the line sensor worked easier for me.
Hardware 
- Water meter (any model with a rotating disk with different infrared reflection should do). I have a Sensus 520/620 meter
- Raspberry Pi with pre-soldered GPIO (raspberrypi.org) pins (any RPi will do, I tested on RPi0W and RPi3B+)
- CNY70 Line sensor (at least with digital out, prefereably also analog out to ease debugging. Working on 3.3V or 5.0V, I used this one (hackerstore.nl))
- Jumper cables to connect to RPi (easier than soldering)
- Arduino or oscilloscope (optional but recommended to ease electronic debugging)
- Some metal/wood/putty/screws for sensor mounting
Installation & oscilloscope debugging 
If you have an arduino: get arduinoscope working (instructables.com).
Connect line sensor to oscilloscope, then try to find the best orientation to detect the contrast in reflection. For me this was under a ±45 degree angle with the plastic window of the water meter, I got a contrast of ±0.5V to ±2.5V.
Once you are comfortable you know how the sensor works, mount it. Optionally use the potentiometer to adjust the digital out threshold. This should ideally be in the midpoint of the min and max voltage. For me this was at ±1.5V ((2.5+5)/2).
Software 
Install python3-gpiozero (readthedocs.io) as pre-requisite, use read_ldr.py (github.com) to debug reading the LDR, get water_worker.py (github.com) to run as daemon.
Add
@reboot /home/pi/water_worker.py
to crontab
Domoticz 
- Create dummy hardware, note idx
- Create virtual water sensor, using JSON
curl --insecure "https://127.0.0.1:10443/json.htm?type=createvirtualsensor&idx=<dummy hardware idx>&sensorname=Water&sensortype=113"curl --insecure "https://127.0.0.1:10443/json.htm?type=setused&idx=<idx of sensor just created>&name=RFXMeter&switchtype=2&used=true"
- Edit name of virtual sensor via web interface, set current value
- Update RFX division to 1000 for water in Domoticz setting (if you’re updating per liter)
- Test updating:
curl --insecure "https://127.0.0.1:10443/json.htm?type=command¶m=udevice&idx=<sensor idx>&svalue=1" - Enter domoticz details in script preamble
Influxdb 
- Create database (e.g. ‘smarthome’)
- Enter influxdb URI in script preamble
- Set current value explicitly in influxdb, the rest will be added incrementally:
curl -i -XPOST http://localhost:8086/write?db=smarthometest --data-binary "water,type=potable,device=sensus value=123456"
References 
- Watermeter elektronisch aflezen (tweakers.net)
- Rood/grijs herkennen van teller op watermeter met CNY70 (circuitsonline.net)
- Analoge meter uitlezen met een Arduino/Raspberry Pi (tweakers.net)
- Watermeter lezen met raspberry en Inductieve NPN sensor (domoticz.com)
Landis+Gyr Ultraheat digital 7-segment LCD heat meter 
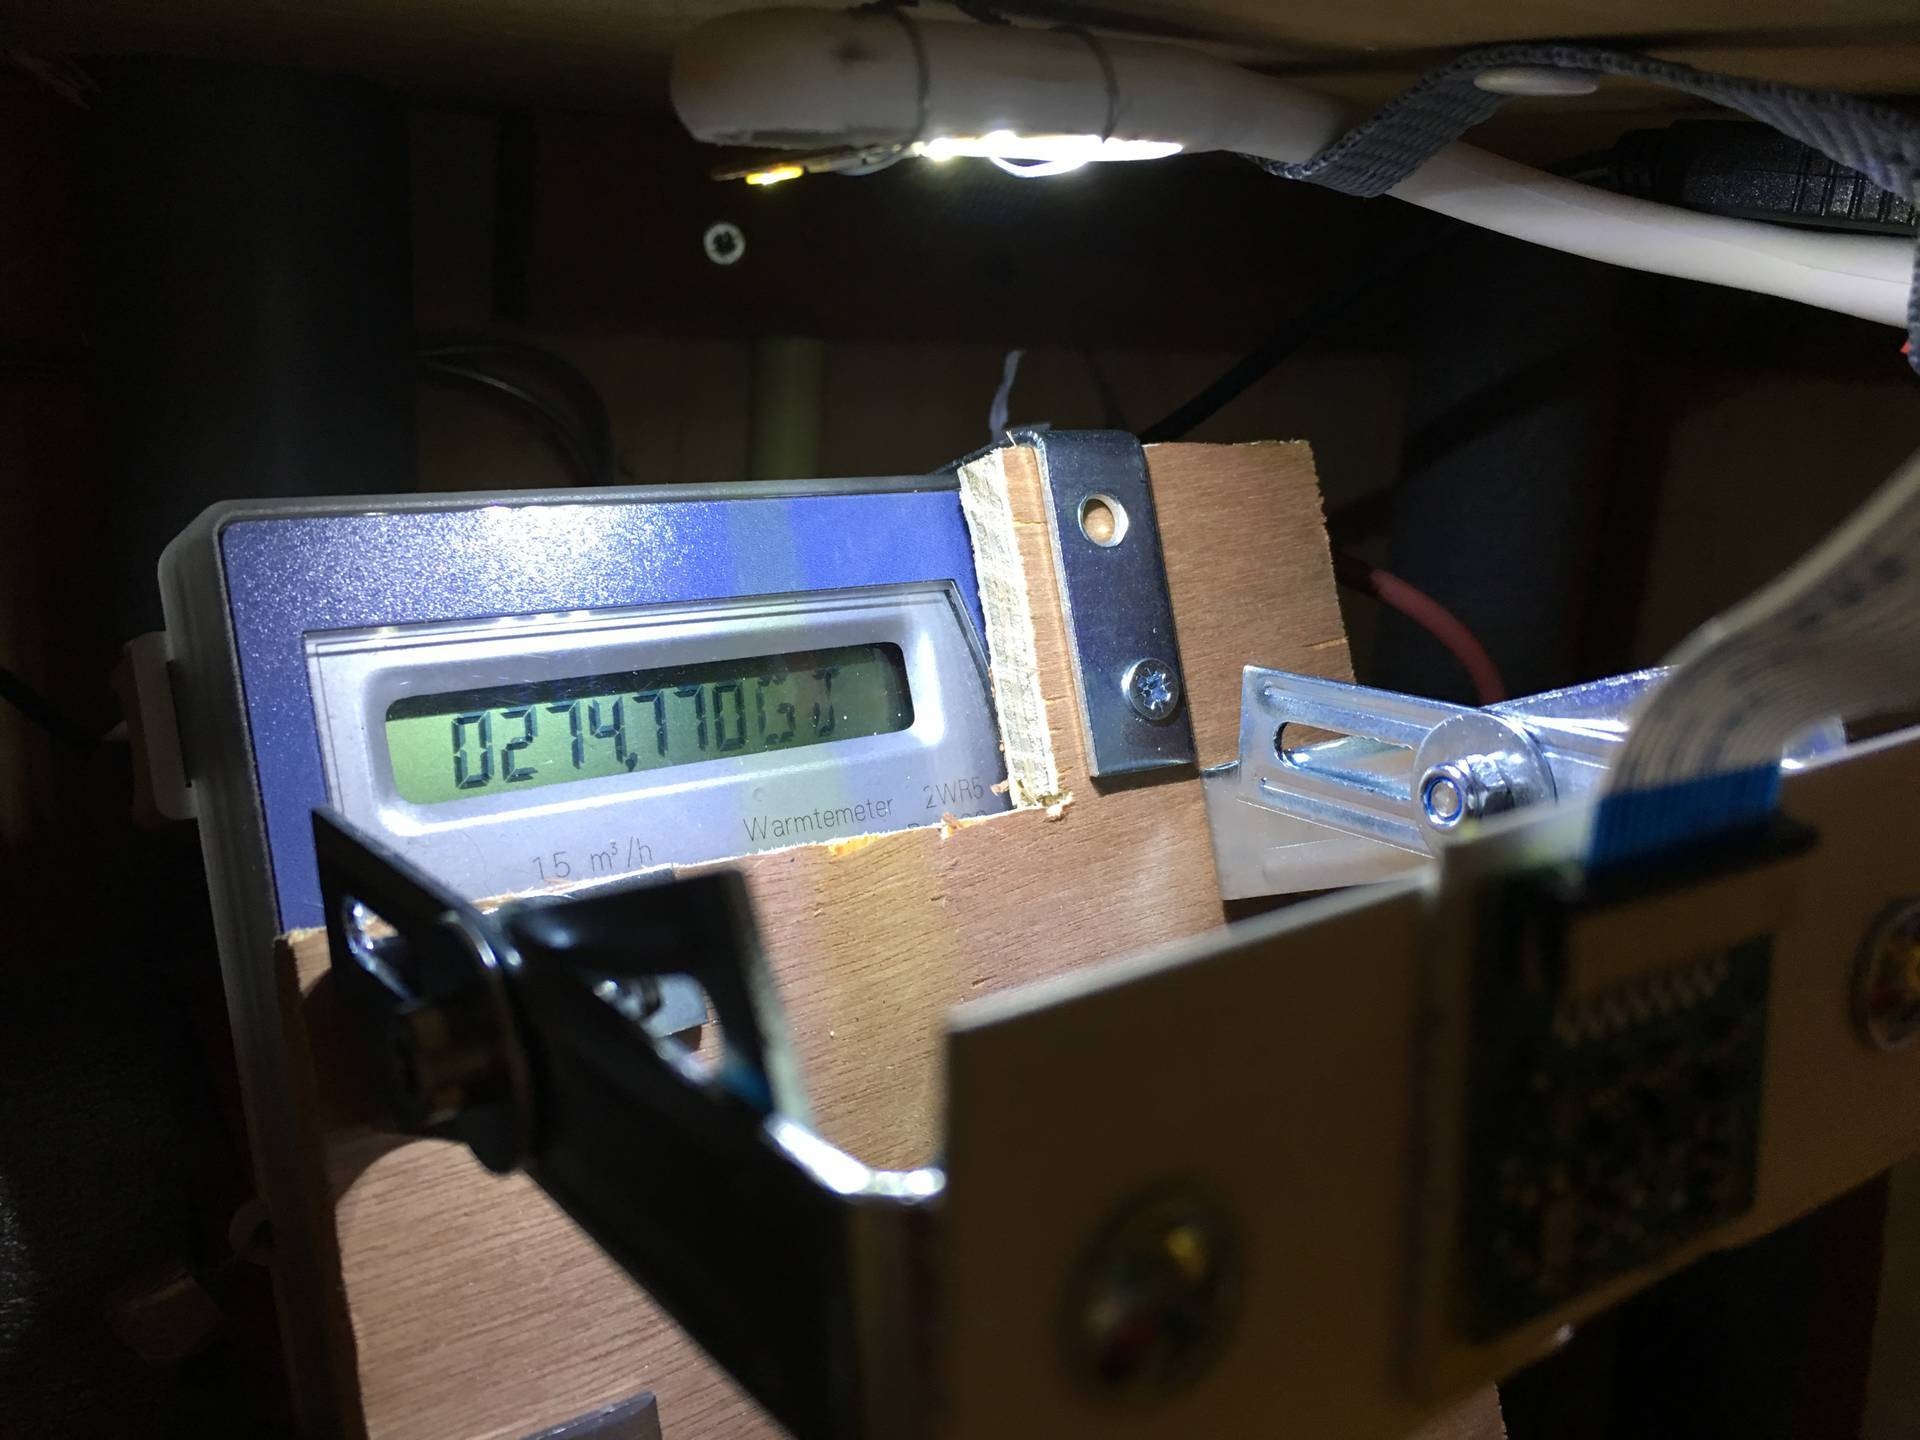
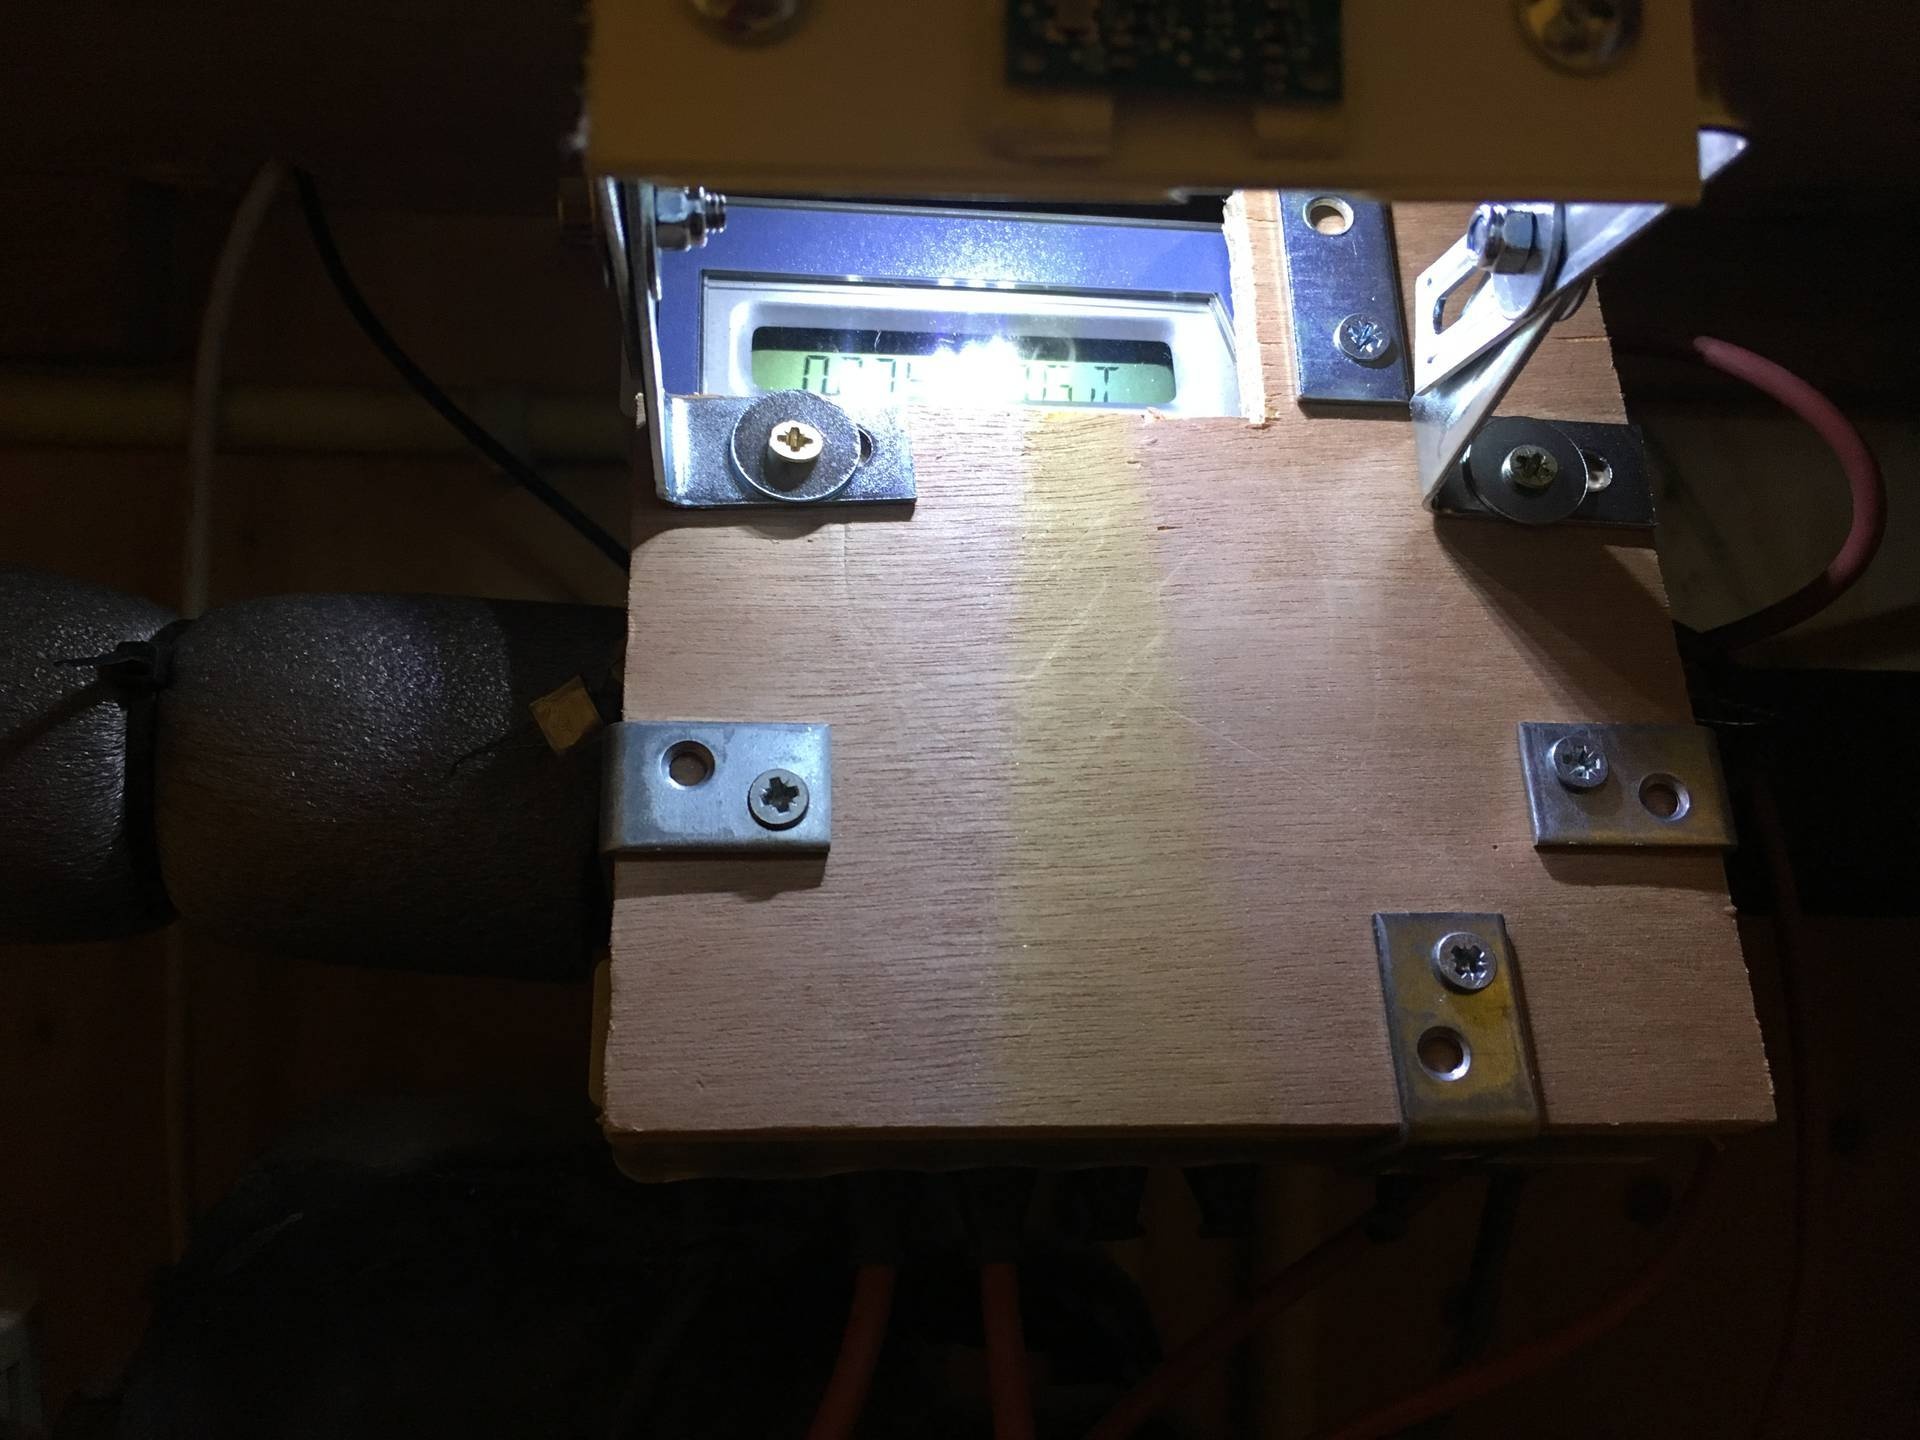
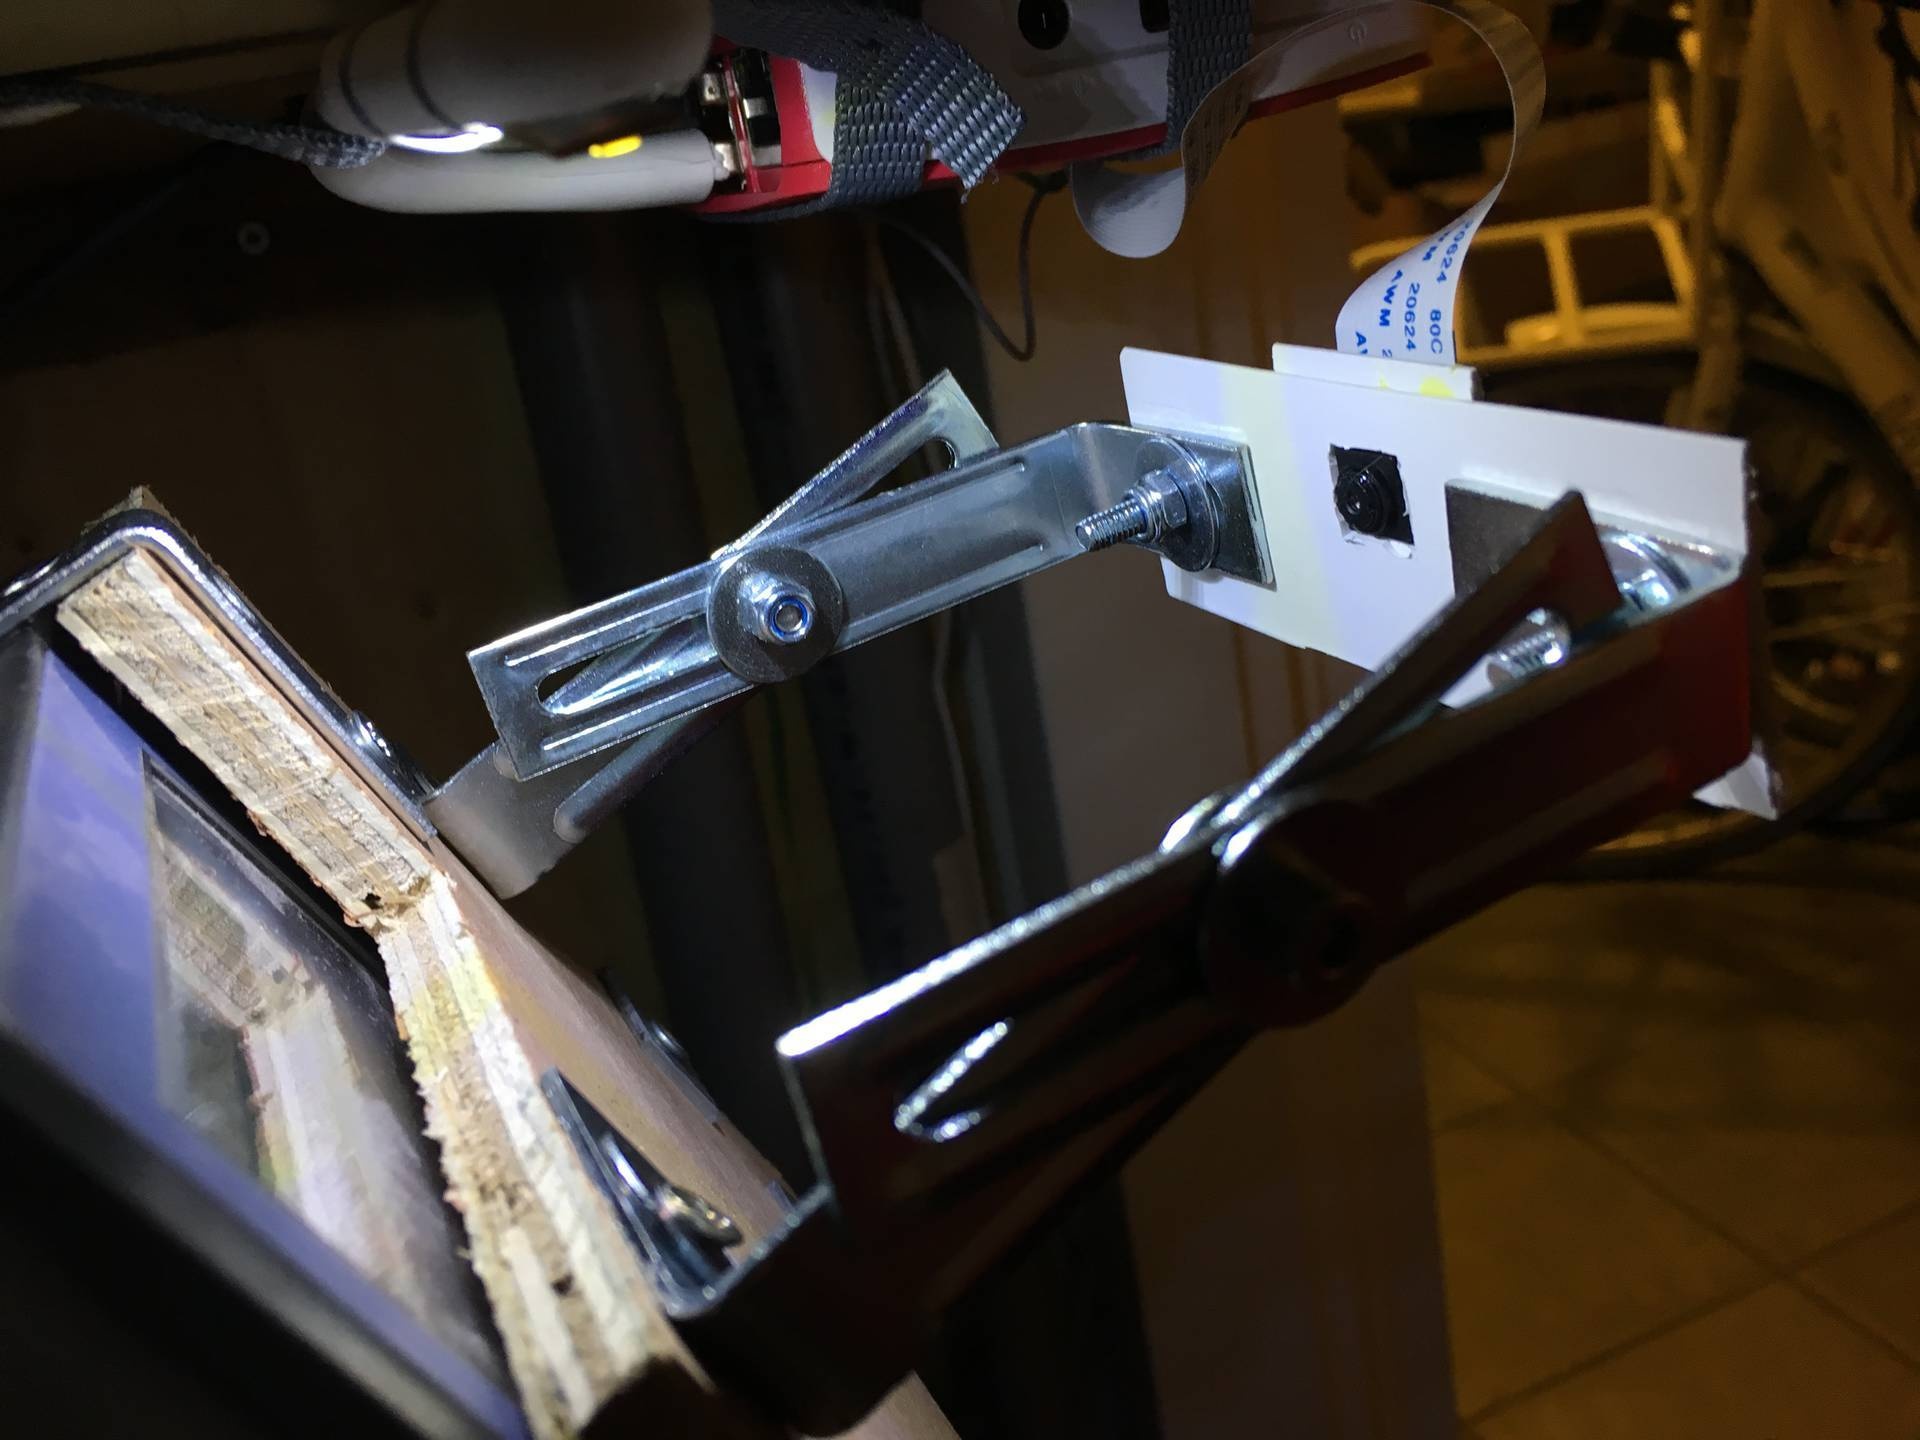
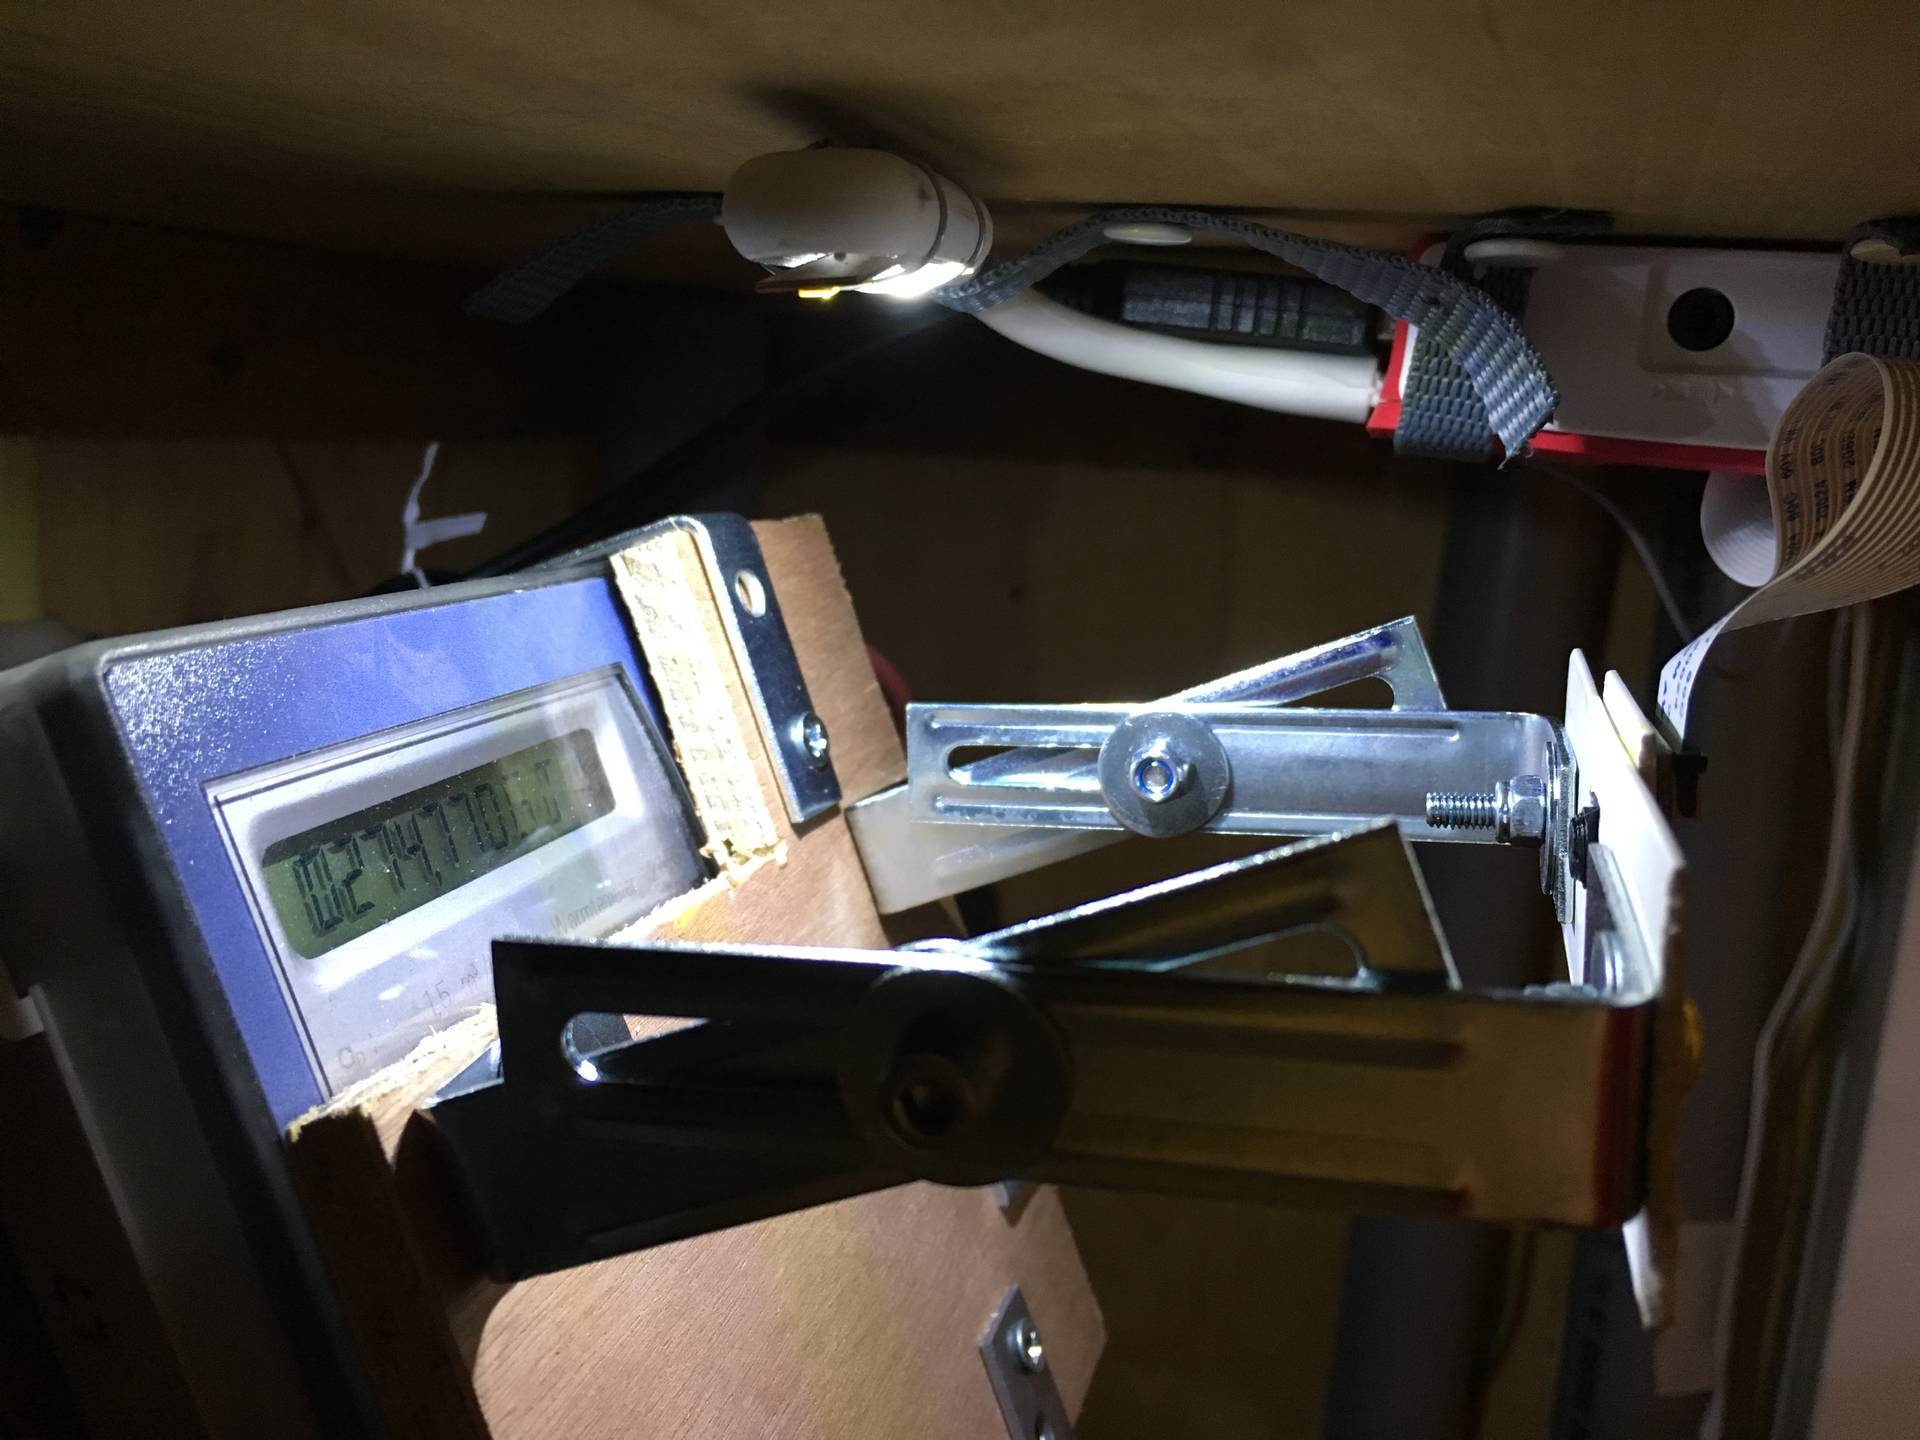
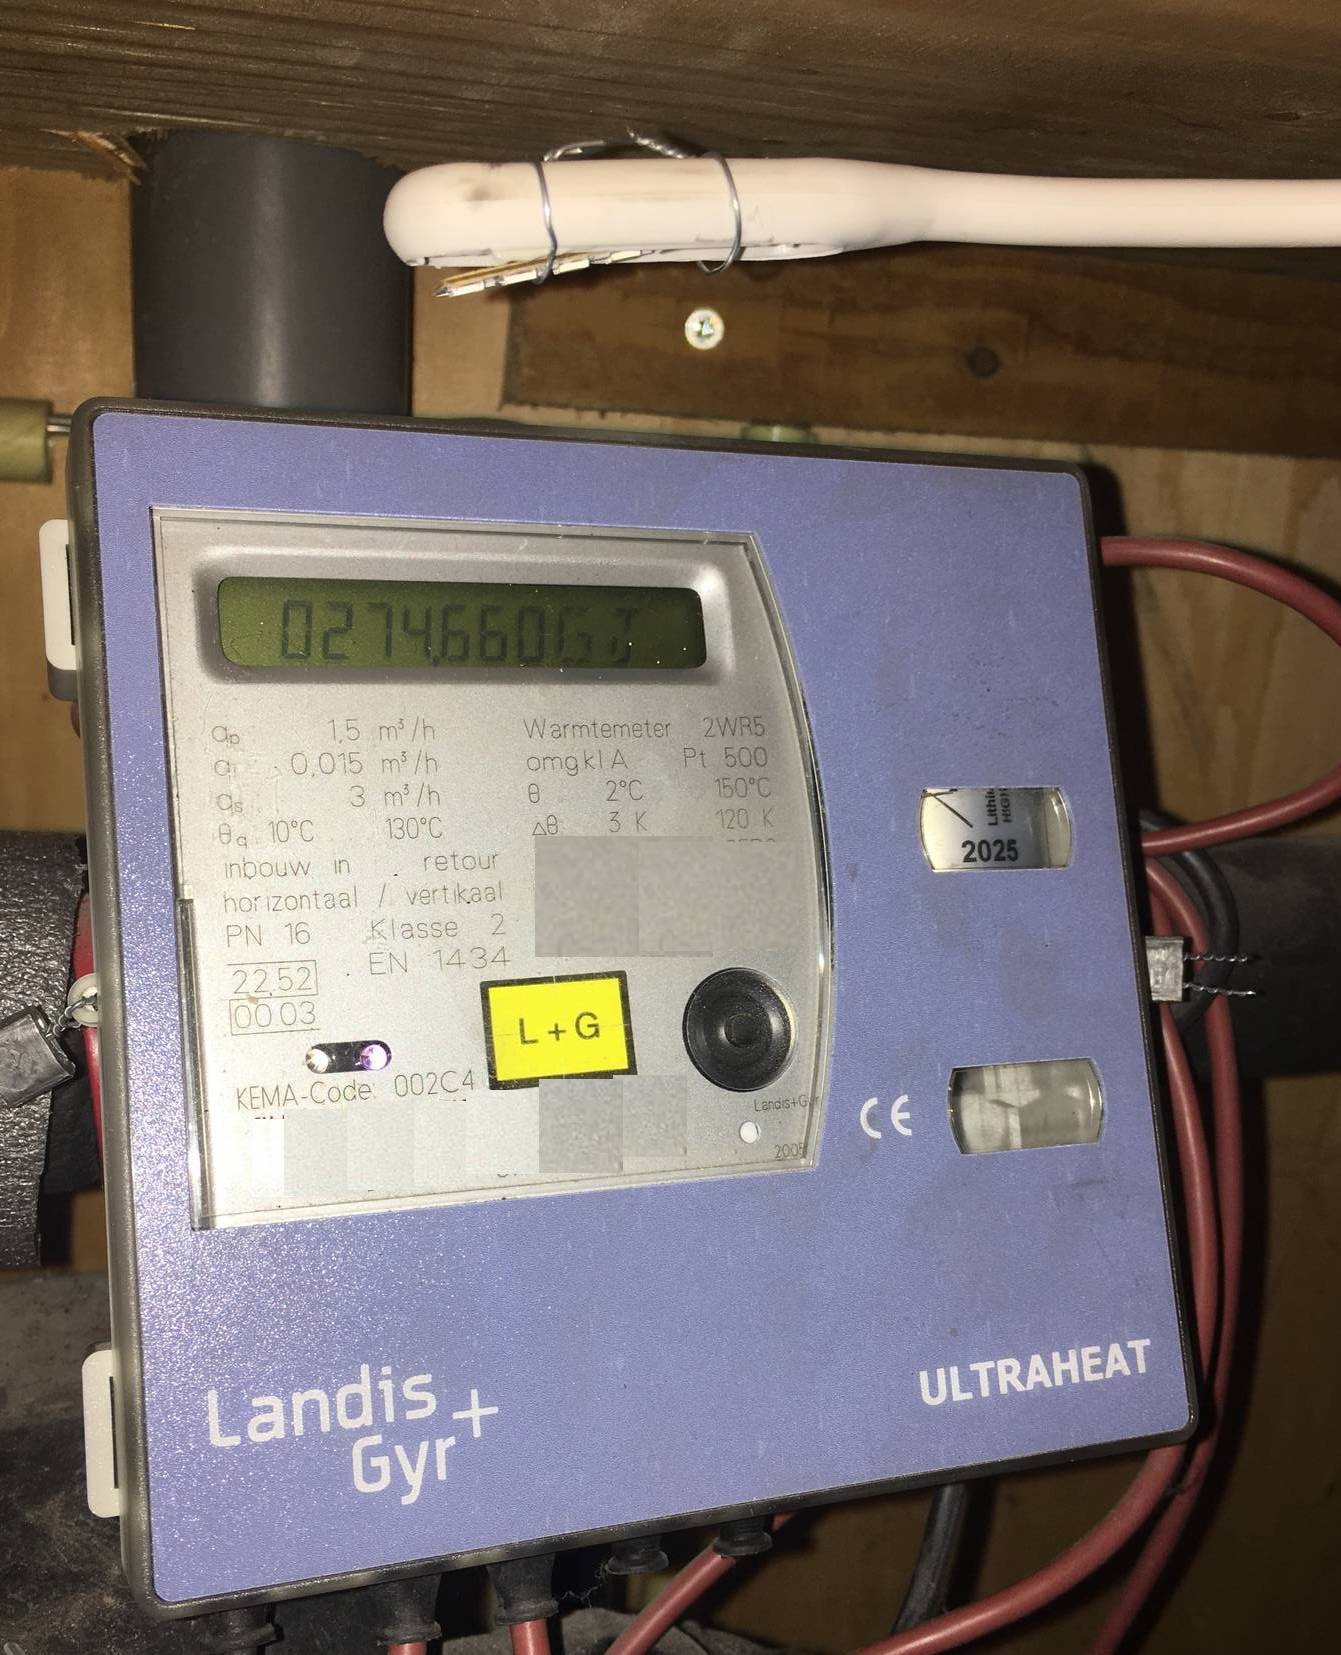
I read out the analog 7-segment LCD display using a camera and some simple OCR using this script (github.com).
Hardware 
- Landis+Gyr Ultraheat
- Camera
- Optional: USB light (as camera flash)
Units 
Meter units is in GJ, with 3 decimal digits (e.g. 271.199 GJ). Value we recognize is in MJ because we ignore the decimal point in OCR. Domoticz units are in m^3, with 2 decimal digits (e.g. 3581.92 m^3) – internally might be stored with higher precision, again not visible through JSON api because of poor interface.
Conversion unit is 13.20772 m^3 gas/GJ, resolution is 0.01 m^3 for total count or 0.001 m^3 for daily count. For electric energy, conversion would be 277.7777 kWh/GJ.
Software 
Test camera:
raspistill --datetime -v -o cam_%d.jpg -t 0
Calibrate using get_digits.py script:
./get_digits.py --calibrate
or if you want to calibrate on an image taken previously
./get_digits.py --calibrate <file>
See README.md (github.com) for detailed instructions to add to domoticz
Alternatives 
- SSOCR - Seven Segment Optical Character Recognition (github.com) looks promising
- Seven Segment Optical Character Recognition (uni-kl.de) is very sensitive to noise, didn’t work for me
- tesseract (wikipedia.org) / character recognition is overkill given the simplicity of seven segment LCD
- openCV’s adaptive thresholding didn’t work for me